The first-ever comprehensive Epigenetic longevity labs to bring together your health history through DNA and methylation testing with over 100 lab tests to deliver actionable insights from top doctors. Just $599 per year to live to 100.
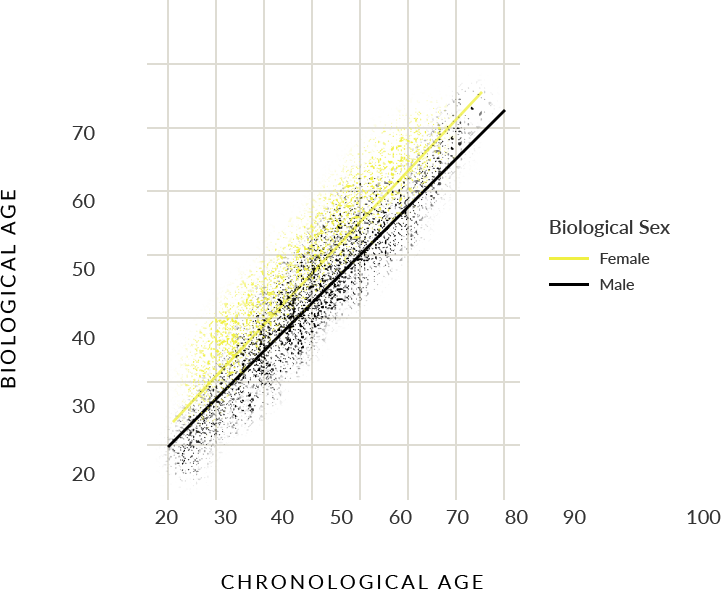
The Annual is the most comprehensive set of tests. Every year. No hidden fees. No insurance involved.
The Follow Up physician consult is done after every test. Compare with past results to see changes.
Focus on specific areas or test everything again. Easy with transparent prices.
5 minutes to book
Book a time slot at one of 2000+ labs across the US.
15 minute lab visit
Annual tests require one lab visits and 8-hour fast.
Take action. Test again.
Results become personalized insights and clinician reviews.


DNA Methylation-Based Biomarkers and the Epigenetic Clock Theory of Aging
Discovering and validating molecular targets for interventions that extend human health span and lifespan has been challenging, as traditional clinical biomarkers fail to adequately represent the core mechanisms of aging. Recently, a groundbreaking development has emerged: DNA methylation-based biomarkers can now provide precise age estimates for any tissue throughout a person’s life. These ‘epigenetic clocks’ connect developmental and maintenance processes to biological aging, forming a cohesive theory of the life course. These cutting-edge epigenetic biomarkers hold the potential to answer enduring questions across various fields, including the fundamental query: why do we age?
Membership includes 100+ lab tests for all major biological functions. Plus access non-routine tests (e.g. allergies). View some of the lab test included.*
Your Hemoglobin is 2% higher compared to people of your same calendar age and sex.
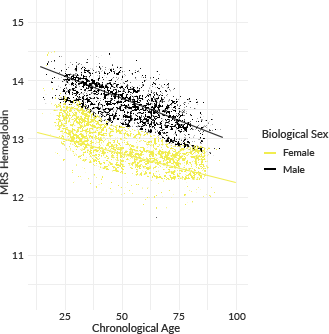
Your Creatinine is 95% higher compared to people of your same calendar age and sex.
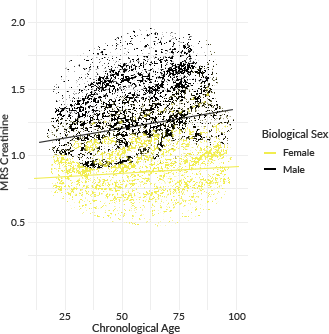
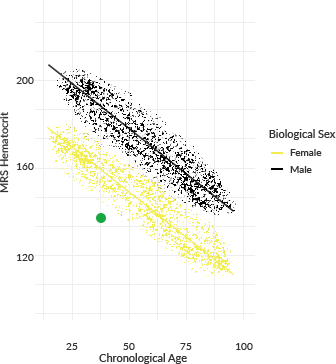
Your Hematocrit is 20% higher compared to people of your same calendar age and sex.
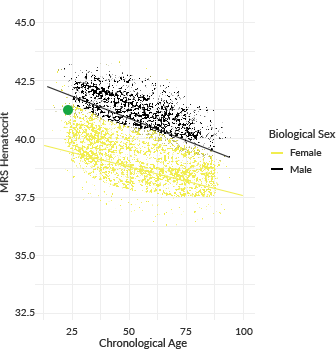
Your Triglycerides is 0% higher compared to people of your same calendar age and sex.
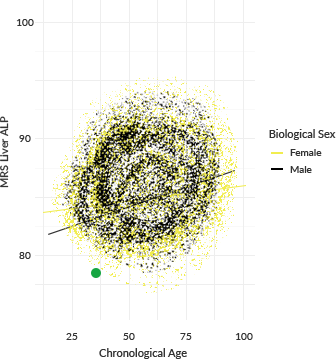
Your Alkaline Phosphatase (ALP) is 6% higher compared to people of your same calendar age and sex.
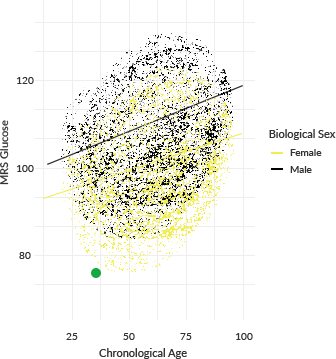
Your Fasting Glucose is 60% higher compared to people of your same calendar age and sex.
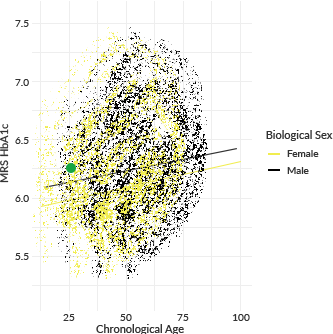
Your HbA1c is 55% higher compared to people of your same calendar age and sex.
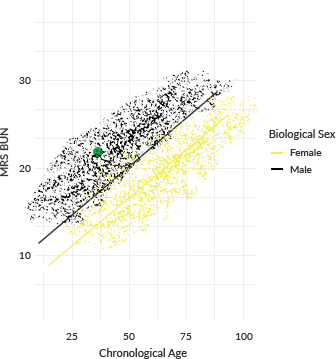
Your Blood Urea Nitrogen (BUN) is 85% higher compared to people of your same calendar age and sex.
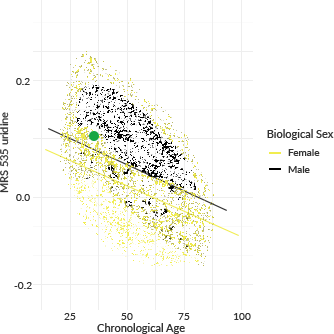
Your Uridine is 51% higher compared to people of your same calendar age and sex.
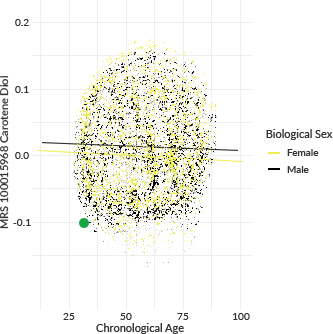
Your Carotene-3,3-diol (Lutein) is 20% higher compared to people of your same calendar age and sex.
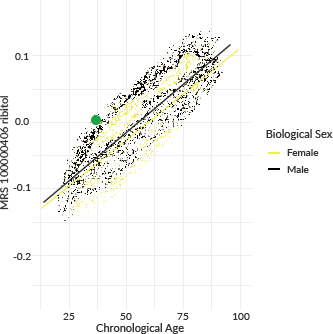
Your Ribitol is 95% higher compared to people of your same calendar age and sex.
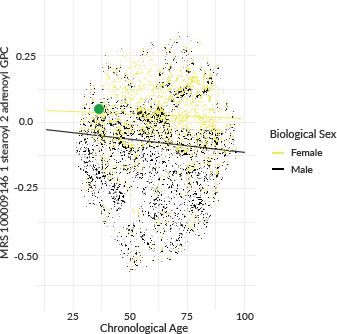
Your 1-stearoyl-2-adrenoyl-GPC (18:0/22:4) (Plasmalogen) is 68% higher compared to people of your same calendar age and sex.
Your N-acetyl-isoputreanine is 55% higher compared to people of your same calendar age and sex.

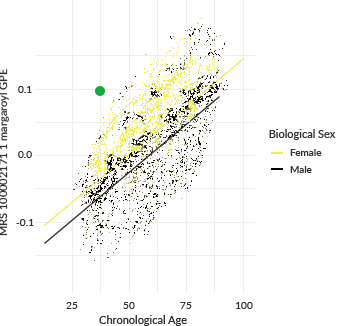
Your Lysophosphatidylcholine (1-margaroyl-GPE (17:0)*) is 100% higher compared to people of your same calendar age and sex.
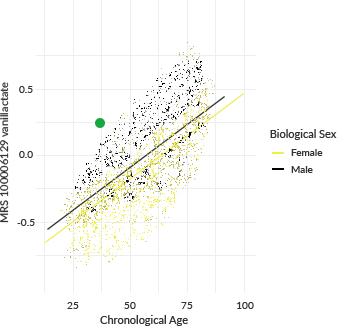
Your Vanillactate acid is 100% higher compared to people of your same calendar age and sex.
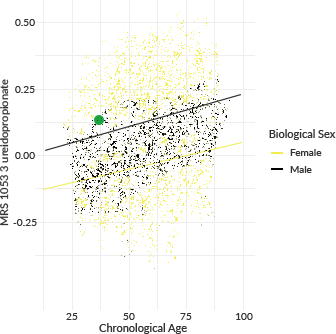
Your 3-ureidopropionate is 57% higher compared to people of your same calendar age and sex.
Your Serum paraoxonase/arylesterase is 3% higher compared to people of your same calendar age and sex.
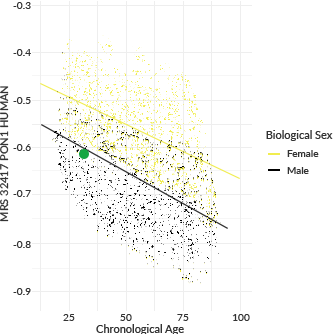
Your Bone morphogenetic protein 1 is 35% higher compared to people of your same calendar age and sex.
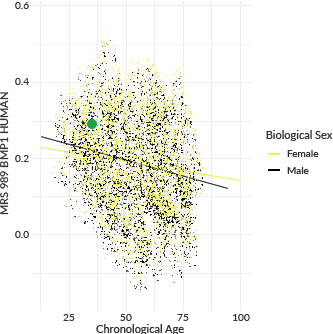
Your Carboxypeptidase B2(CPB2 or thrombin-activatable fibrinolysis inhibitor) is 100% higher compared to people of your same calendar age and sex.
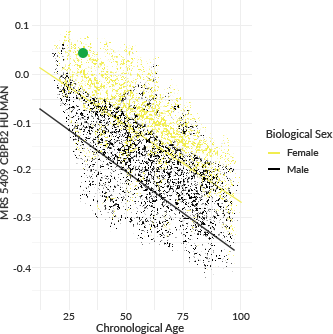
Your Albumin is 100% higher compared to people of your same calendar age and sex.
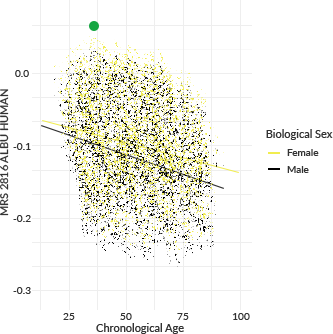
Your Histone H2B type 1-K is 40% higher compared to people of your same calendar age and sex.
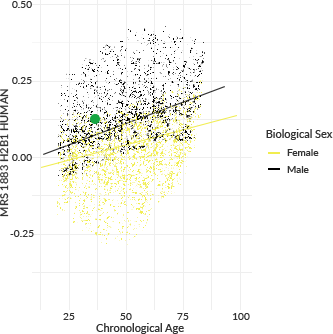
Your Versican core protein is 1% higher compared to people of your same calendar age and sex.
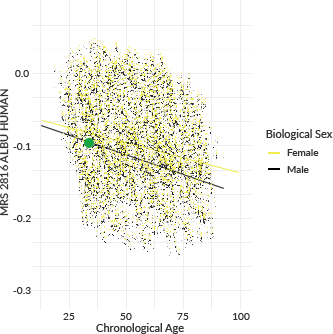
Your Insulin-like growth factor-binding protein 2 is 5% higher compared to people of your same calendar age and sex.
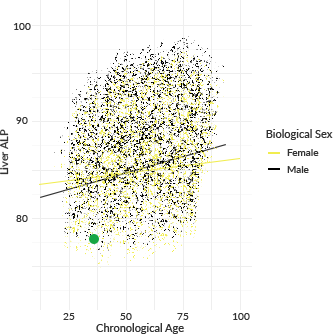
Your Matrix-remodeling- associated protein 5 is 100% higher compared to people of your same calendar age and sex.
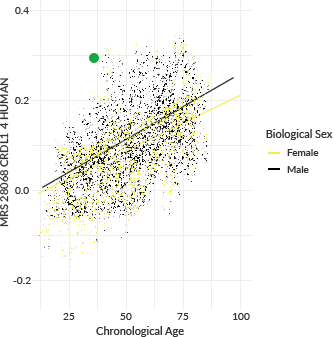
Developed with Yale*
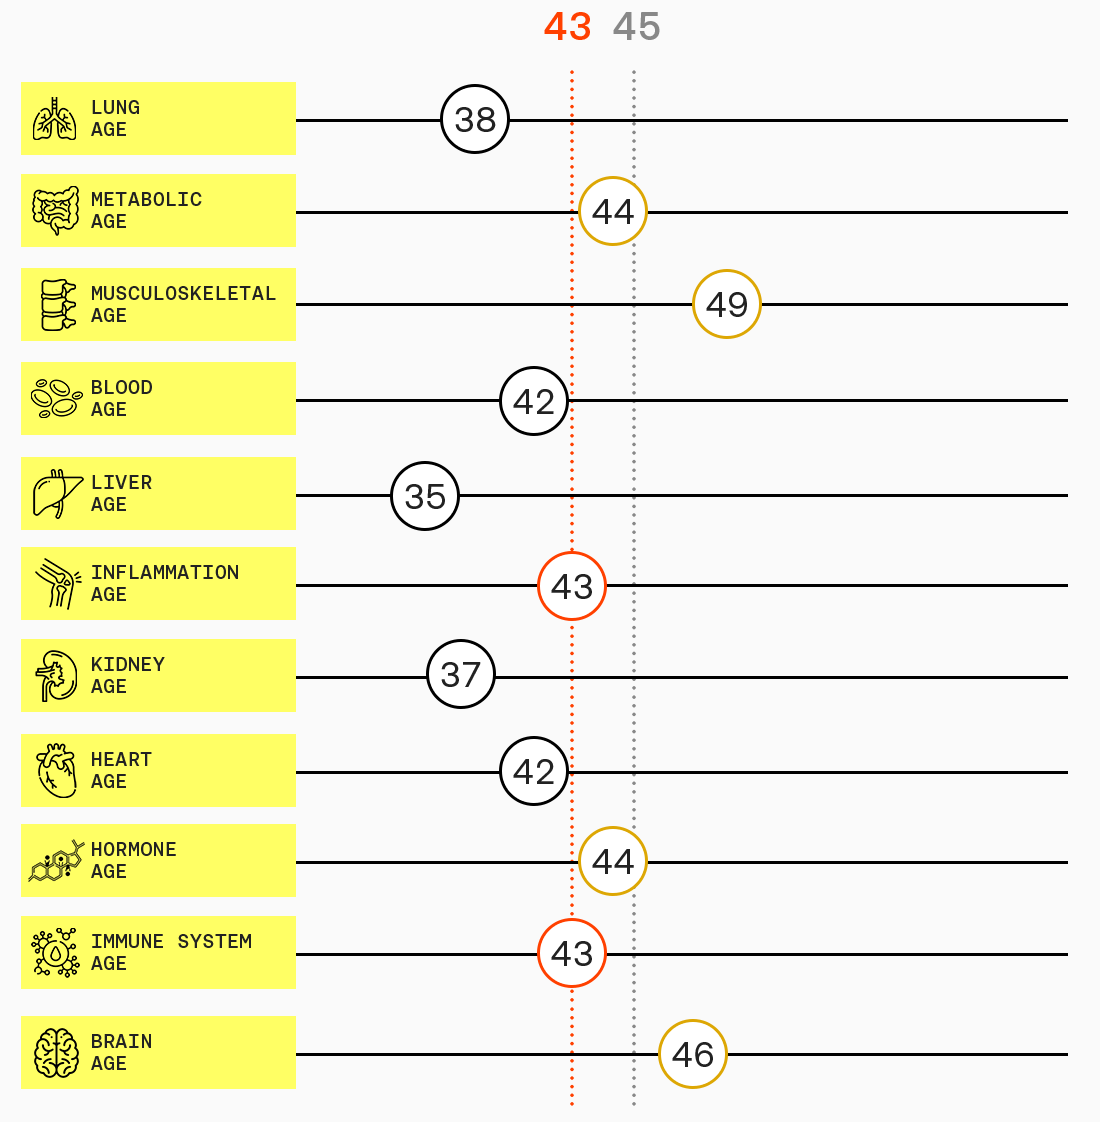
The center bar serves as a baseline marker for your chronological age. Here you can see the difference between your organ ages versus your chronological age.
Black is less than your chronological age, Yellow is more than your chronological age, and Orange is equal to your chronological age. The Grey line is your overall SYMPHONYAge.
| IMMUNE CELL TYPE | REFERENCE MEAN | 95% CONFIDENCE INTERVAL RANGE | YOUR PERCENTAGE |
|---|---|---|---|
| Naive CD4T | 7.273% | 7.196%-7.35% | 3.59% |
| Memory CD4T | 5.212% | 5.14%-5.284% | 2.05% |
| Memory CD8T | 6.605% | 6.519%-6.691% | 9.00% |
| Naive CD8T | 1.125% | 1.09%-1.16% | 0% |
| Basophils | 1.041% | 1.026%-1.056% | 0.77% |
| B Memory | 1.737% | 1.689%-1.785% | 1.03% |
| Naive B | 2.259% | 2.207%-2.311% | 0% |
| Regulatory T | 3.506% | 0.604%-6.408% | 2.89% |
| Eosinophils | 0.400% | 0.376%-0.424% | 0% |
| Natural Killer | 3.406% | 3.353%-3.459% | 5.08% |
| Neutrophils | 62.93% | 62.899%-62.953% | 74.86% |
| Monocyte | 4.510% | 4.453%-4.567% | 0.73% |
The incorporation of physical fitness measurements into epigenetic clocks increases the measurable effects of lifestyle, medical, and environmental interventional changes on the aging process. The DNAmFitAgeAccel algorithm, also simply known as FitAgeAcceleration, was developed by researchers at UCLA, and is an estimate of epigenetic age acceleration. We have created a version of this, however, we incorporated our OMICm Age algorithm (developed with Harvard) instead. We call this OMICm FitAge, which tells you how old you are according to your physical fitness and functionality.
YEARS OLD

Your OMICm FitAge is
Your calendar age by 4.30 years.
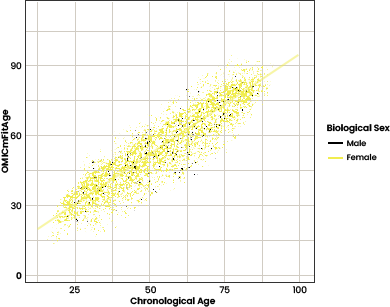
For every one year older OMICm FitAge is, there is an average 0.29 decrease in relative grip strength and 0.32 increase in BMI. OMICm FitAge has estimated that high-fit individuals (classified through VO2max) have a 1.5 to 2.0 younger biological age compared to low/medium-fit individuals in females and males, respectively. Younger OMICm FitAge was associated with better memory test performance, emphasizing the beneficial role of physical exercise on cognitive health.

If we were to estimate your biological age strictly from your telomere measurement, wewould anticipate your age to be:
YEARS OLD
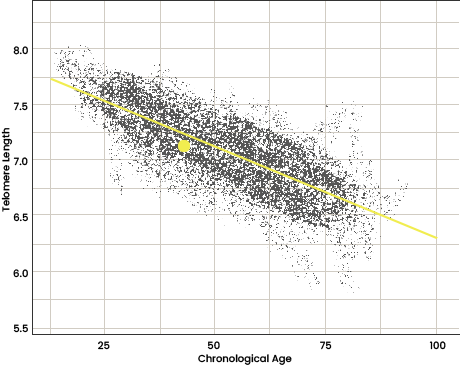
Your average telomere prediction length:
This puts you in the:
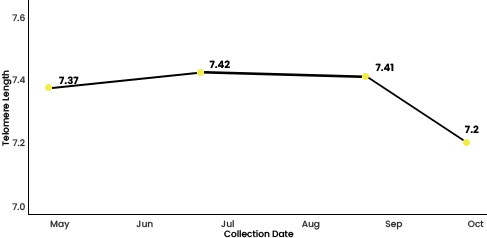
| Algorithm | Patient Data | Morbidity and Mortality Associations | Risk Statement | Telomere | 7.2 Kilobase Unit | At your chronological age of 61, your telomeres are longer than 40% of people who share the same chronological age as you. | Shorter telomeres are not only associated with age but with disease too. Shorter telomere length and low telomerase activity are correlated with several chronic preventable diseases. |
|---|
Stay aware of how your body is changing.
Results stored in one secure place
for easy access anytime.
The full cost of testing is included. With advanced tests typically not covered by insurance. 5x more tests than an average physical.
Get insights from top doctors and 1000s of hours of research based on your results. Read your Clinician’s Summary written by a clinical team after every test. Clinicians call you promptly if any urgent results arise.
Results charted over time in one secure place for easy access. Share with doctors anytime.
Partnered with top recognized labs. Over 2,000 locations around US. Lab visits average 15 min.
Testosterone Replacement Therapy:
Nausea or vomiting
Infertility or decreased sperm count
Testicular shrinkage
Worsening of obstructive sleep apnea
Increase in cholesterol levels
Abnormal spike in blood sugar levels, which can increase the risk of developing Type 2 diabetes
Yellowing of the skin or around your eyes
Uncomfortable swelling or enlargement of breast tissue (gynecomastia)
Redness, warmth around lower leg area
Unusual increase in red blood cell count, which can result in high blood pressure, joint/muscle pain, trouble with eyesight or thrombosis (blood clotting)
Frequent need to urinate
Fluid retention
Acne or oily skin
Headaches
Lumps or hardening around injection site
Clomid:
Headaches
Nausea
Bloating
Mood swings
Diminished sex drive
Sperm counts decrease (can be reversed by changing Clomid to another type of estrogen blocker, such as tamoxifen.)
Acne
Chest tenderness
Blurry vision
Weight gain
High blood pressure (hypertension)
Altered taste
Asthma
Flushing
Excess thirst
Joint aches
Enclomiphene
Libido issues
Acne
A temper if levels get too high
Mood swings
Depression
Mood irritability
Anxiety
Gynecomastia
Headache
Nausea
Diarrhea
Dizziness
Common Cold
Hot flush
Joint pain
NOTE: Enclomiphene is the purified isomer of Clomid (Clomiphene Citrate)